Essential Last Mile Delivery Metrics for Small and Growing Businesses

Tracking the right delivery metrics can transform your last-mile delivery operations. Here's exactly what to measure and how to improve each number.

- Track key last mile delivery metrics helps to reduce costs, improve efficiency, and boost customer satisfaction.
- Delivery success rate and on-time delivery performance that directly impact customer experience with perishable products.
- Failed first delivery attempts cost you twice—once for the initial attempt and again for the retry—and can seriously affect product quality.
- Driver productivity (stops per hour) and cost per delivery are key profitability indicators that can be improved through route optimization.
- Customer feedback provides early warning signs of delivery issues before they affect your bottom line.
- Fuel consumption, capacity utilization, and driver turnover are often-overlooked metrics that can significantly impact operational costs.
- Choosing the right last-mile delivery software can help monitor and improve most of these metrics.
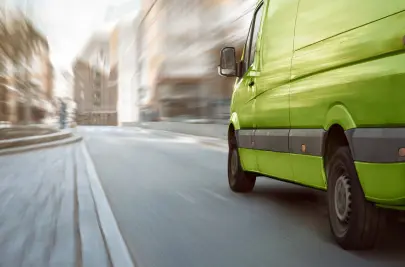
If you're building a delivery service for your business, you’ll know that tracking the right metrics is essential for success. Last mile delivery — that final leg of the journey from your facility to your customer's door — is often the most challenging and costly part of the entire fulfillment process. Identifying and tracking the right KPIs is the key to improving your delivery efficiency, eliminating bottlenecks, and building customer loyalty.
Operational efficiency in last mile logistics is especially critical for food and beverage business. Delivery delays can lead to spoiled goods, directly impacting customer satisfaction and your reputation.
Despite these challenges, the last mile market is growing rapidly. Driven largely by the surge in online shopping, Statista predicts that the last mile market will grow to over $200 billion by 2027.
In the rest of this article, we’ll list 10 key metrics that will help you make data-driven decisions to track and improve your delivery performance.
The most important last-mile delivery KPIs you need to track

This section lists 10 key performance indicators (KPIs) that help to monitor the performance and health of your last-mile delivery operation. With this information at your fingertips, you should find decision-making easier.
Important note: You don’t have to implement all of these at once! If you’re just starting out, choose one to three KPIs that are most relevant to your business. For example, new delivery operations should probably focus first on delivery success rate, on-time delivery, and cost per delivery
It may take a couple of months to implement the systems you need to gather the required data, analyse it in the most useful way and make changes to your operations. Once you can see the benefits and things are running smoothly, look for the next metrics to track.
💡One of the easiest ways to measure and improve most of these KPIs is to use delivery management software. Check out Routific’s 7-day free trial to see how our route optimization and analytics can make your delivery operations more efficient.
1. Delivery success rate
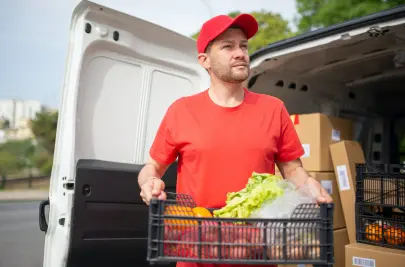
Delivery success rate measures how reliably you're keeping promises to customers — a fundamental metric for any delivery business. It’s especially crucial if you’re delivering product, food, or beverages — customers expect fresh products, delivered exactly as ordered with nothing damaged, melted, or spoiled.
How to measure delivery success rate
Delivery success = Number of successful orders ÷ total number of deliveries × 100
A successful delivery is defined as one where the order arrives on time, contains all the correct items, and everything is in good condition. In practice, count a delivery as successful if it was completed on time and the customer hasn’t complained about order accuracy or quality.
What good looks like: Small food businesses should aim for at least 95% successful deliveries. Anything below 90% requires immediate attention.
How to improve delivery success
- Implement route planning software to ensure efficient delivery routes.
- Collect accurate customer information (access codes, for example) and ensure it’s shared with drivers in their delivery notes.
- Use real-time tracking to quickly solve problems as they arise.
- Train drivers specifically on handling perishable goods properly.
- Use the notifications feature in your delivery management software to communicate clearly with customers about delivery windows.
- Use appropriate packaging and temperature control for your products.
Real example: A local farm box delivery service improved their success rate from 88% to 97% by implementing a simple checklist system for drivers and better insulated containers for their produce.
Real example: As Greenhouse Juice expanded their delivery operations, they went from one driver going to a dozen or so stops a day, to a fleet of vans delivering to hundreds of locations every week. Routific’s route optimization helped them maintain reliable deliveries while scaling up. As a result, they can sometimes deliver even faster than Amazon prime.
2. On-time delivery rates

On-time delivery cuts to the heart of the customer experience. Meet expectations, and it’s easy to get high customer satisfaction scores. On the other hand, delivery delays cause inconvenience and frustration — and in the case of food and other perishables, even spoiled products.
How to measure your on-time delivery rate
On-time delivery rate = Number of on-time deliveries ÷ total deliveries
What good looks like: Small food delivery businesses should target at least 90% on-time deliveries. Restaurant suppliers need to aim even higher - 95%+.
How to improve on-time delivery
- Define what “on-time” means in your specific business. Is it within the promised window, or exactly when promised?
- Use route optimization software to calculate realistic ETAs and delivery schedules.
- Offer your customers reasonable delivery windows (2-3 hours) rather than specific times.
- Build buffer time into routes to allow for unexpected delays.
- Track deliveries in real time to alert customers about potential delays.
Real example: Zurich-based food business Bowlz makes and delivers around 300 fresh lunches every day. Thanks to a strong back-office operation, they’re able to offer their customers one-hour delivery time windows, and deliver on time.
3. Failed first delivery attempts/missed delivery rates
Every missed delivery costs you twice — once for the initial attempt, and again for the retry. For perishable food deliveries, this is especially problematic as product quality degrades with each delay.
Common reasons for failed first deliveries include:
- The customer isn't home.
- Address information is inaccurate or incomplete.
- The delivery location is inaccessible.
- There’s no safe place to leave temperature-sensitive items.
How to measure missed delivers
Missed delivery rate = Number of failed first attempts ÷ total deliveries
What good looks like: The best delivery operations keep failed first attempts under 3%. Anything above 8% seriously impacts profitability.
How to improve missed delivery rates
- Send automated notifications before delivery.
- Offer specific delivery time slots rather than all-day windows.
- Use address verification at checkout to prevent errors.
- Create clear instructions for what drivers should do if no one is home.
- For perishable items, offer safe drop options like insulated boxes or coolers.
Real example: A farm box delivery service reduced their failed first attempts from 12% to just 2% by implementing a simple text notification system that alerted customers 30 minutes before arrival.
4. Driver productivity

Driver productivity — the number of stops your drivers can complete per day or per shift — directly impacts your delivery capacity, labor costs, and profitability. Maximizing stops per hour can mean the difference between profitable routes and losing money.
How to measure driver productivity
Stops per hour = Total stops ÷ driver hours
What good looks like: This varies significantly based on your delivery area. Urban routes might achieve 6-8 stops per hour, while suburban routes might only manage 3-5. Track your own numbers to establish your baseline.
How to improve driver productivity
- Use route optimization software to minimize travel time between stops.
- Capture delivery notes (gate codes, parking tips) to save time on future deliveries.
- Assign drivers to routes and areas they are familiar with.
- Standardize loading procedures to get drivers on the road faster.
- Provide drivers with properly organized manifests and clear delivery instructions.
Real example: Farm share delivery company Walden Local used route optimization to eliminate inefficiencies in their delivery operations. With better data about actual route times, their demand planning manager was able to predict how many drivers she would need each day, and increase the number of orders delivered per hour.
5. Cost per delivery
Understanding your true cost per delivery is essential for pricing your delivery service and maintaining profitability. For small food businesses, this metric helps you determine minimum order values and delivery fees. The better you understand your cost per delivery, the more easily you can identify opportunities for cost savings.
How to measure cost per delivery
Cost per delivery = Total delivery costs (fuel + labor + vehicle maintenance + packaging) ÷ number of deliveries
What good looks like: This varies widely based on your delivery area density and order values. Track this metric weekly and monthly to identify trends. A declining cost per delivery is a good sign.
How to improve cost per delivery
- Optimize routes to reduce miles driven and increase driver productivity.
- Group deliveries by neighborhood.
- Set minimum order values for different delivery zones.
- Consider delivery days for specific areas to increase delivery density.
- Review and adjust your delivery zones based on profitability.
6. Customer complaints

Tracking customer feedback provides early warning signs of delivery issues before they impact your bottom line. Complaint patterns often reveal problems in your last-mile delivery process that might otherwise go unnoticed.
How to measure customer complaints
Customer complaints = Total number of queries and complaints ÷ total deliveries
To get the most out of this KPI, track your queries and complaints by category. For example, in a typical food and beverage delivery business the most useful categories might include:
- “Where is my order” (WISMO)
- Late delivery
- Damaged items
- Wrong items
What good looks like: Aim for complaint rates below 2% of total deliveries. More importantly, watch for trends and recurring issues.
How to improve customer complaints
- Set appropriate customer expectations: Be clear about your turnaround times and delivery time windows.
- Create a simple system to track and categorize all customer feedback.
- Review complaints weekly to identify patterns.
- Implement specific training based on common issues.
- Follow up with customers who complain to show you're listening.
- Use customer feedback to improve packaging, delivery instructions, and routing.
- Use automated customer notifications to send accurate ETAs and proof of delivery.
7. Fuel consumption
Fuel is one of the largest variable costs in last-mile delivery operations, directly impacting your bottom line and sustainability. Optimizing fuel usage means more profit from each route.
How to measure fuel consumption
Fuel consumption rate = Miles per gallon (or km per litre). Measure per vehicle and for your fleet as a whole.
Fuel cost per delivery = Total fuel cost ÷ number of deliveries
What good looks like: The baseline varies by vehicle type and delivery area, but you should aim for consistent improvement. Tracking week-over-week changes helps identify issues early.
How to improve fuel efficiency
- Optimize routes to minimize total distance and avoid traffic.
- Regular vehicle maintenance (tire pressure, oil changes).
- Driver training for fuel-efficient driving techniques.
- Consider more fuel-efficient vehicles when upgrading your fleet.
- Group deliveries by neighborhood to reduce backtracking.
8. Capacity utilization
Maximizing your vehicle's capacity on each route means fewer trips and lower costs. You can deliver more orders without adding vehicles or drivers.
How to measure capacity utilization
Physical capacity = Volume or weight of orders ÷ vehicle capacity. For example: If your vehicle can take 50 boxes but you’re only sending 30, 40% of your delivery capacity is unused.
What good looks like: Aim for at least 75% capacity utilization without overloading drivers or compromising delivery quality.
How to improve capacity utilization
- Standardize packaging sizes to make loading more predictable.
- Train staff on efficient loading techniques.
- Use route optimization software that considers vehicle capacity.
- Adjust delivery zones and schedules to balance loads across your fleet.
- Consider different vehicle sizes for different delivery needs.
9. Driver turnover

High driver turnover increases hiring and training costs, while reducing delivery quality and customer satisfaction. Retaining good drivers — especially those who know their territories well — will help improve average service time and maintain service quality.
How to measure driver turnover
Driver turnover % = Number of drivers who leave in a period ÷ average number of drivers employed × 100
What good looks like: The industry average for delivery driver turnover can exceed 100% annually. Aim to keep yours below 50% by creating a better driver experience.
How to improve driver retention
- Use route optimization to create reasonable, achievable routes.
- Provide clear delivery instructions and support.
- Implement fair compensation based on route difficulty and performance.
- Recognize and reward drivers who consistently perform well
- Create opportunities for driver feedback on routes and procedures.
10. Damage claims rate
Product damage can destroy customer trust and lead to costly remakes or refunds. Damage claims directly affect your bottom line and can reveal problems in your handling, packaging, or delivery processes.
How to measure damage claims rate
Damage claims rate = Number of damage claims ÷ total number of deliveries × 100
What good looks like: The best delivery operations keep damage claims below 1%. Anything above 3% indicates serious problems with your packaging or handling procedures.
How to improve damage claims rate
- Review your packaging design for durability and product protection.
- Implement proper temperature control for perishable items.
- Train drivers on careful handling techniques for fragile items.
- Analyze damage patterns to identify problem areas (particular routes, drivers, or products).
- Consider weather conditions when planning routes and packaging.
- Use delivery management software to track and analyze where and when damage occurs.
- Add clear handling instructions on packages with fragile items.
Why the last mile delivery market is growing
As the last mile becomes more and more important, delivery businesses must prioritise streamlining their delivery process so that they can enjoy the cost and time savings that come with doing things more efficiently. Below, we’ve listed a few key reasons why the market is on the rise:
- E-commerce and online shopping growth: As online shopping grows, customers expect fast — often same-day or next-day — delivery services. These expectations means that even small businesses must focus their attention on optimizing the delivery experience.
- Everything now available online: Growth in e-commerce means that customers can now order anything from a burger to a bulldozer online. As such, last mile delivery businesses need to be able to deliver all of this stuff — be it something perishable or something big and bulky.
- Tech innovations: New technologies play a big part in the growth of last mile logistics and providing valuable insights that providers can use to up efficiency. Things like route optimization software, GPS tracking, autonomous vehicles, and drone deliveries enable logistics companies to automate every aspect of the supply chain. This automation is helping the industry improve efficiency, reduce costs, and speed up deliveries. But, often, the latest and greatest technology is only available to the bigger players and has become a competitive advantage for those that can afford it.
- Cold chain logistics innovations: Advancements in cold chain technology simplify how food and beverage businesses deliver perishable goods like groceries, meal kits, fresh juices and frozen foods items.
- Direct-to-Consumer (DTC) brands: As businesses choose to bypass traditional brick-and-mortar stores in favour of offering products directly to customers online, there is more demand for specialized last-mile delivery services that deliver shipments to a customer’s doorstep.
Frequently Asked Questions
Last Mile Delivery Costs — Challenges and Solutions

8 Practical Ways To Improve Delivery Efficiency